A natural consequence of the observed shift in volumes to closing auctions has been the thinning of flow going through continuous trading sessions. In a previous article, we highlighted how in recent years, for various reasons, lit addressable volumes have gravitated toward the closing auction away from continuous trading sessions. In this article, we provide more colour on the impact that this has had on the local market structure, by exploring how intraday liquidity during continuous trading hours has evolved over the years, and further assess the extent to which liquidity events and interconnectedness of global markets influence intraday volume profiles at the JSE.
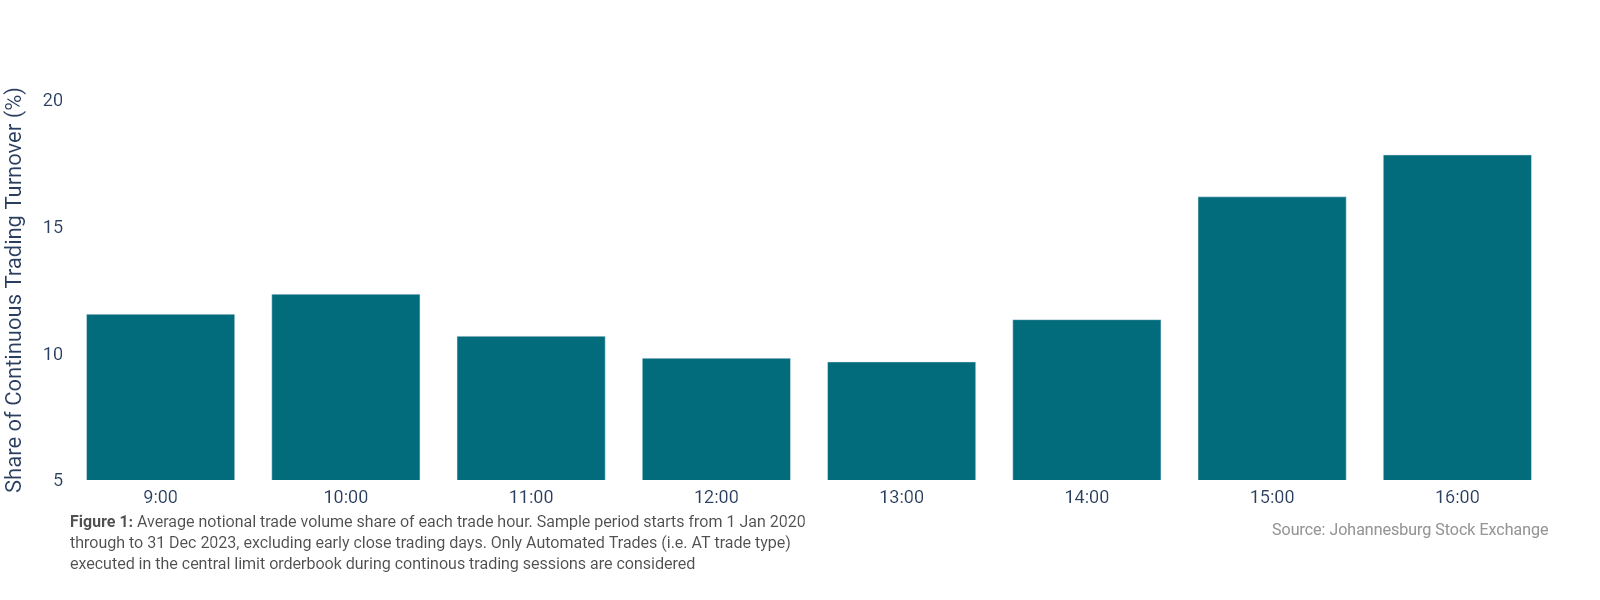
Figure 1 shows the average hourly intraday liquidity profile at the JSE during continuous trading hours. Data indicates that (i) intraday volume has a relatively convex profile (ii) on average, the greatest share of daily turnover is executed in the afternoon and (iii) there is on average a marginal pick-up in activity in the hour starting at 10am before volumes continue to drop until the afternoon. These results are not entirely surprising and are consistent with a phenomenon observed in various financial markets, colloquially referred to as a “liquidity smile.” This feature describes an observation in equity markets whereby liquidity will concentrate at the start and end of a trading, with a trough in the middle due to thin trading around lunch time.
Volumes after the open are declining.
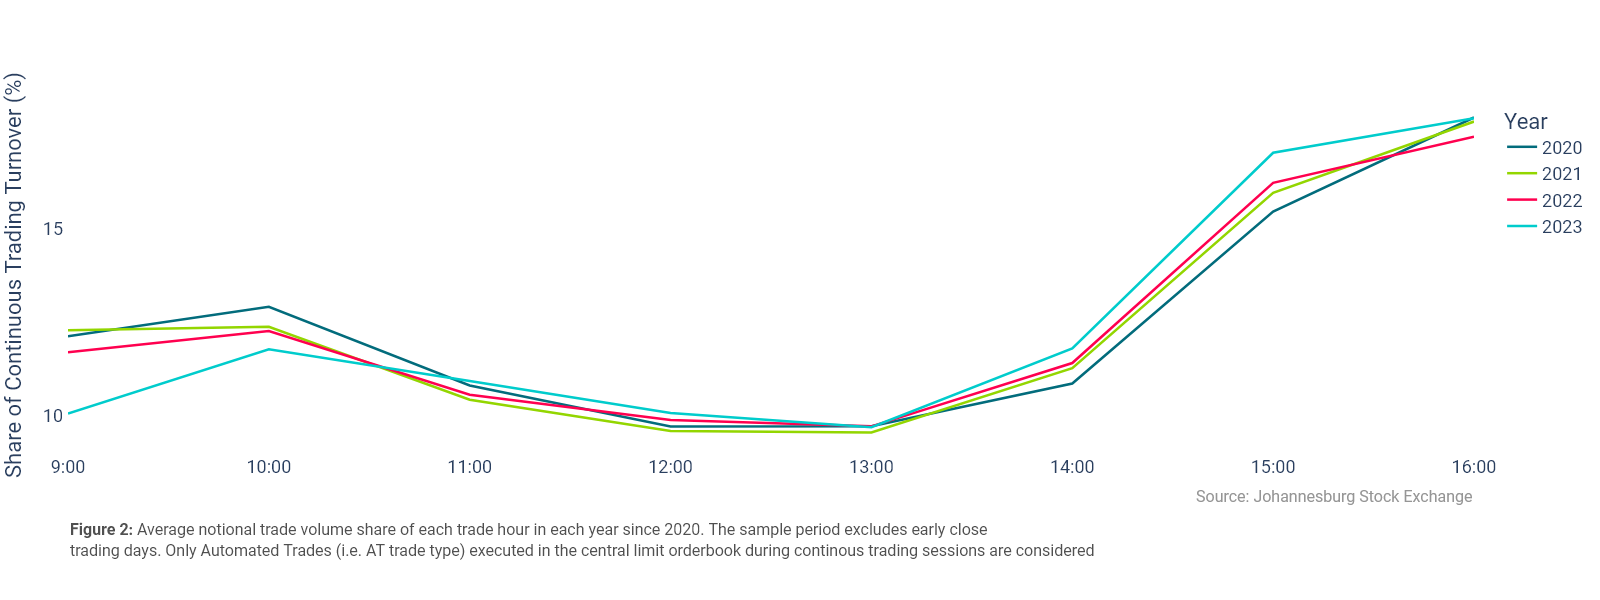
Analysing the how the liquidity smile has evolved over the years reveals a couple of interesting points. Figure 2 below highlights that (i) there has been a decline in volumes executed after the open, and (ii) the share of volumes in the afternoon is increasing. Turnover in the hour starting at 9am has gone from accounting for ~12% of all lit continuous activity down to ~10%. Conversely, the hour starting at 3pm has gone from accounting for ~15% up to 17%. This tilting of the curve appears to be happening around 1pm and is an anticipated result. Over the same period, the share of lit addressable activity executed in the closing auction has increased from 19% to 25%, increasing its significance as the largest liquidity event of the day. It is therefore unsurprising that volumes are gravitating towards that time of the day.
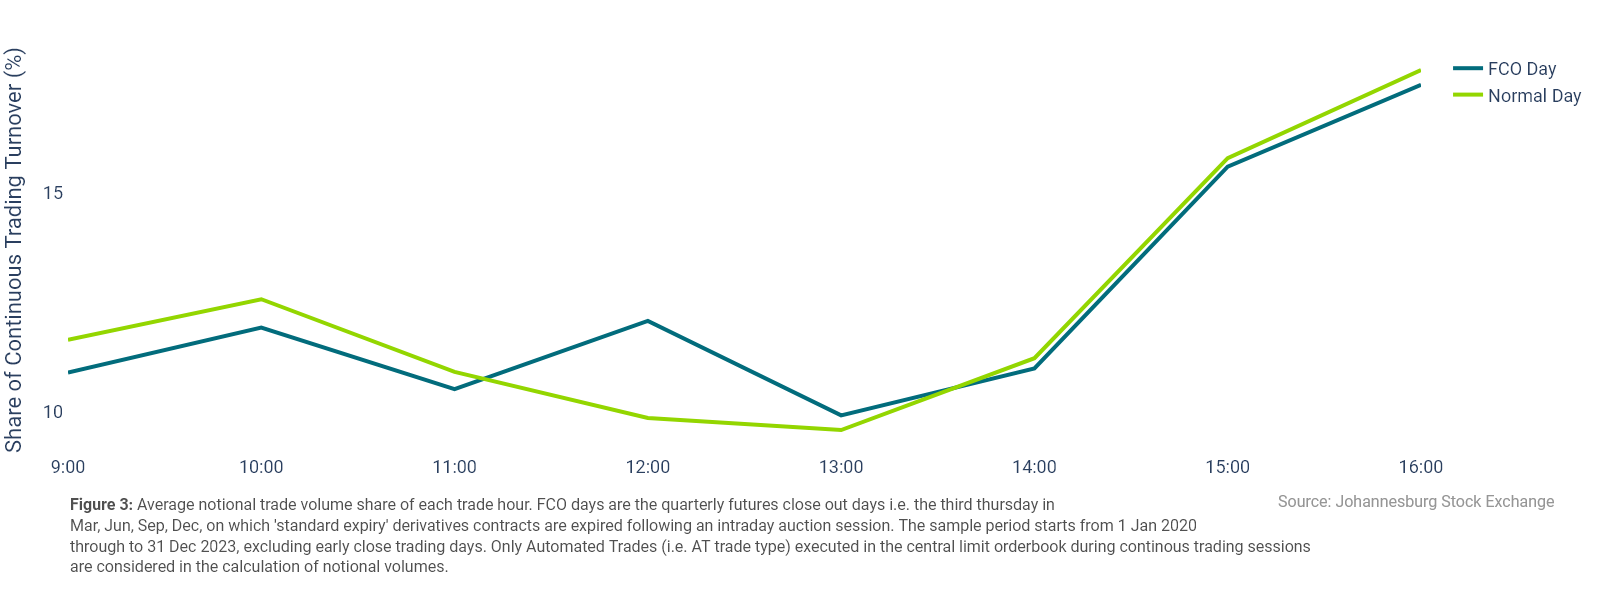
Local and international liquidity events have an influence on the liquidity smile.
The significance of the role played by auction sessions in determining the profile of the liquidity smile is also highlighted when a comparison is made between Futures Close Out (FCO) dates and normal trading days. FCO dates stand out because on these days, the intraday auction (between 12:00 and 12:15) is generally the largest liquidity event of the trading day. Figure 3 shows that on average, less volumes are executed before noon on FCO days relative to normal trading days. In the 45mins following the FCO auction we generally observe a pick-up in continuous trading volumes before the liquidity profile reverts to typical levels in the hour starting at 1pm through to the end of continuous trading.
Lastly, previous studies have shown that changes in the operating hours of significant interconnected markets may impact the liquidity profile at a given venue. The data indicates that this observation holds true in the South African equity markets as well. Figure 4 shows the average intraday volume profile over two distinct periods, when daylight savings is observed in the northern hemisphere and when it isn’t. To be specific, only the days on which daylight savings is observed in both London and New York are assigned to the daylight savings category. It is evident that market open in both these financial centres has an impact on the local intraday liquidity profile.
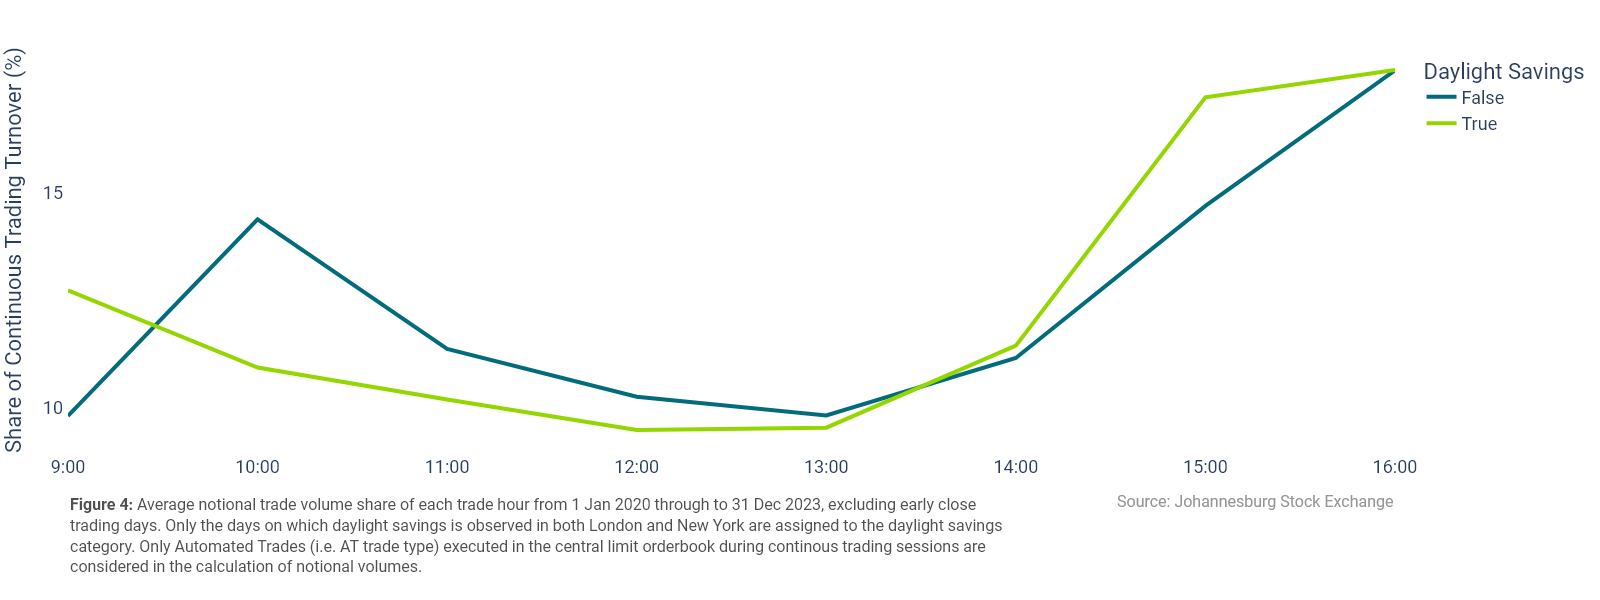
When daylight savings is not being observed, 10am SAST is the most liquid hour in the morning at the JSE, accounting for 14% of continuous trading volumes. In contrast, when daylight savings is observed and clocks move forward by one hour in the northern hemisphere, the most liquid hour in the morning becomes 9am SAST. In both instances, peak liquidity in the morning coincides with market open in London at 08am BST. The impact of the US equity markets can also be seen later in the trading day when New York opens at 09:30am EDT. Figure 4 shows that when daylight savings is being observed, there is an up-tick in liquidity in the hour starting 3pm SAST, or 9am EDT. However, when the clock in New York is moved back by an hour, there does not appear to be a significant difference in the liquidity profile of the hour starting 4pm SAST. These results are expected, given the proliferation of trading strategies involving dual listings between the markets, and the significant weighting of these counters in overall daily volumes.
Summary:
- Intraday liquidity has shifted over time. Continuous trading volumes are gravitating towards the closing auction away from the morning.
- Regular liquidity events, like the FCO auction, have an impact on intraday liquidity.
- The high degree of interconnectedness between financial centres has led to events like relative changes in the operating hours key markets having an influence on liquidity.